Sidebar

Main Menu Mobile

  • Home
  • Blog(s)
    • Marco's Blog
  • Technical Tips
    • MySQL
      • Store Procedure
      • Performance and tuning
      • Architecture and design
      • NDB Cluster
      • NDB Connectors
      • Perl Scripts
      • MySQL not on feed
    • Applications ...
    • Windows System
    • DRBD
    • How To ...
  • Never Forget
    • Environment
  • Search
TusaCentral
  • Home
  • Blog(s)
    • Marco's Blog
  • Technical Tips
    • MySQL
      • Store Procedure
      • Performance and tuning
      • Architecture and design
      • NDB Cluster
      • NDB Connectors
      • Perl Scripts
      • MySQL not on feed
    • Applications ...
    • Windows System
    • DRBD
    • How To ...
  • Never Forget
    • Environment
  • Search

JavaScript in MySQL: Extending SQL, Not Moving the Application

Details
Marco Tusa
MySQL
15 October 2026

scaled goatAt Percona Live Europe 2026, Dmitry Lenev and I presented JavaScript in My Database? Over My Dead Query, the story of component_js_lang, the V8-based JavaScript engine for Percona Server for MySQL 8.4. That experience told us few things:

  • The presentation was seen as “for developers”
  • What most DBA or DevOps heard was "JavaScript in the database" = "application logic in the database"

This let most of the people pictured developers shipping their business logic into stored procedures. Order workflows, pricing rules, REST calls, all running inside mysqld. 

That picture is wrong, and in this post I want to replace it with the right one, using the same four demos we showed on stage.

The fear is reasonable, the target is wrong

DBAs have earned their skepticism. Many of us have inherited a schema where thousands of lines of stored procedures were the application: impossible to test, impossible to version, impossible to scale out, and owned by nobody who still works there.

So when a new language arrives inside the server, the reflex is to protect the database from becoming an application server again. 


We share that reflex.

The point of this post is that JavaScript routines, used as designed, do not move us in that direction. They move the opposite way: they make SQL stronger so that less logic needs to be pulled out of the database and re-implemented somewhere else.

The engine itself also enforces the boundary. Inside component_js_lang a routine has:

  • No network I/O. No fetch(), no sockets. A routine cannot call your payment provider or another microservice.
  • No file system access. It cannot read configs, keys or files.
  • No Node.js or DOM APIs. No require(), no process, no npm ecosystem.
  • No useful async. Everything runs synchronously inside the statement.

You cannot build an application with that toolbox. However you can build very good functions!

What JavaScript routines are actually for

A JavaScript routine extends the SQL vocabulary. It is a new function you call from SELECT, JOIN, WHERE, GROUP BY or a trigger, exactly like LOWER() or JSON_EXTRACT(). The only new syntax is LANGUAGE JS:

CREATE FUNCTION norm_keys(d JSON) RETURNS JSON
DETERMINISTIC NO SQL LANGUAGE JS AS $$
  const walk = (j) => {
    if (j === null || typeof j !== 'object') return j
    if (Array.isArray(j)) return j.map(walk)
    const out = {}
    for (const [k, v] of Object.entries(j))
      out[k.toLowerCase()] = walk(v)
    return out
  }
  return walk(typeof d === 'string' ? JSON.parse(d) : d)
$$;


The rule we kept repeating on stage is simple: SQL owns the set, JavaScript owns the value. SQL is unbeatable at filtering, joining, ordering, windowing and aggregating. Where SQL and its procedural language stop is a short, very specific list:

  • Recursion over a shape not known in advance. JSON_TABLE needs every path as a literal.
  • Arrays. SQL has no array type, so any algorithm that fills a grid has nowhere to live.
  • Big integers. BIGINT stops at 19 digits; an IBAN checksum needs 29.
  • Real iteration with aggregates. A recursive CTE cannot contain an aggregate or window function (ERROR 3575), and a WHILE loop in PL pays an executor round trip on every statement.
  • Rich string handling. UPPER() and LOWER() do not know that McDonald has a capital D.

None of these is business logic. They are missing building blocks. JavaScript supplies them and hands the result straight back to SQL.
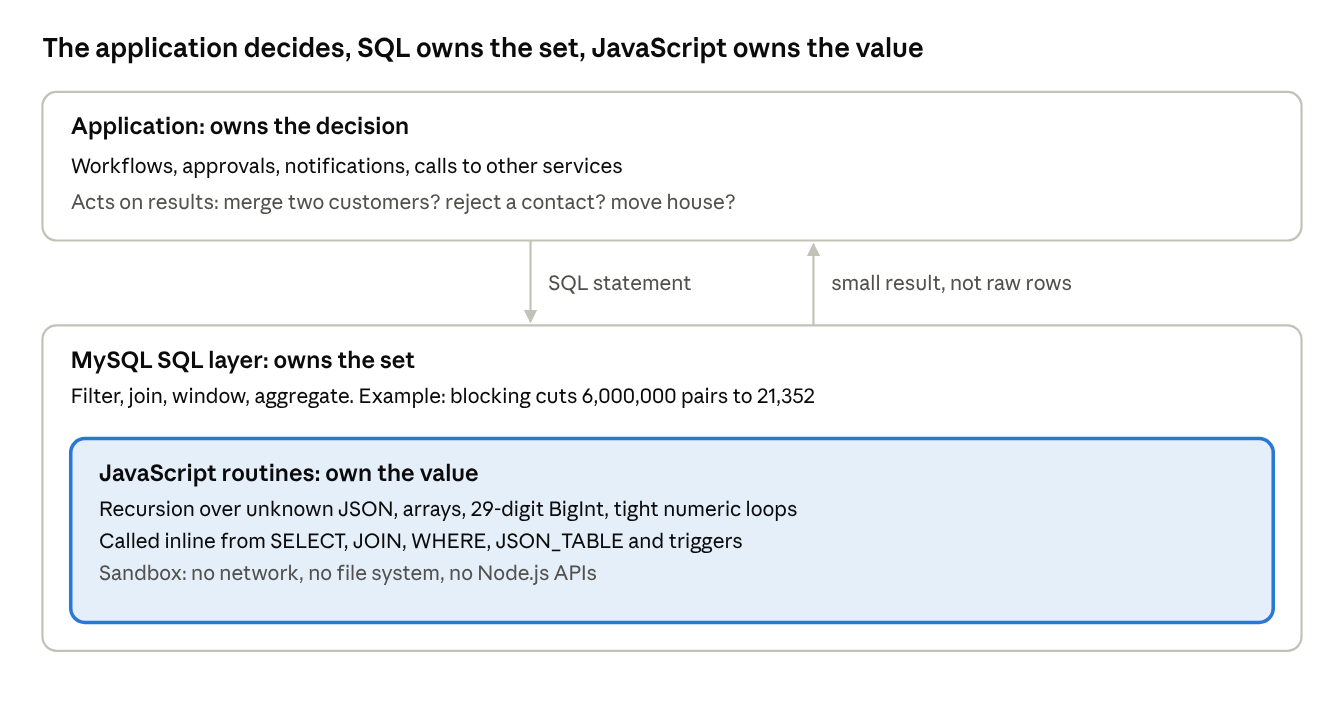
schema

The JavaScript routine lives inside the SQL layer, not beside the application: a query calls it, and it returns a value to that query.

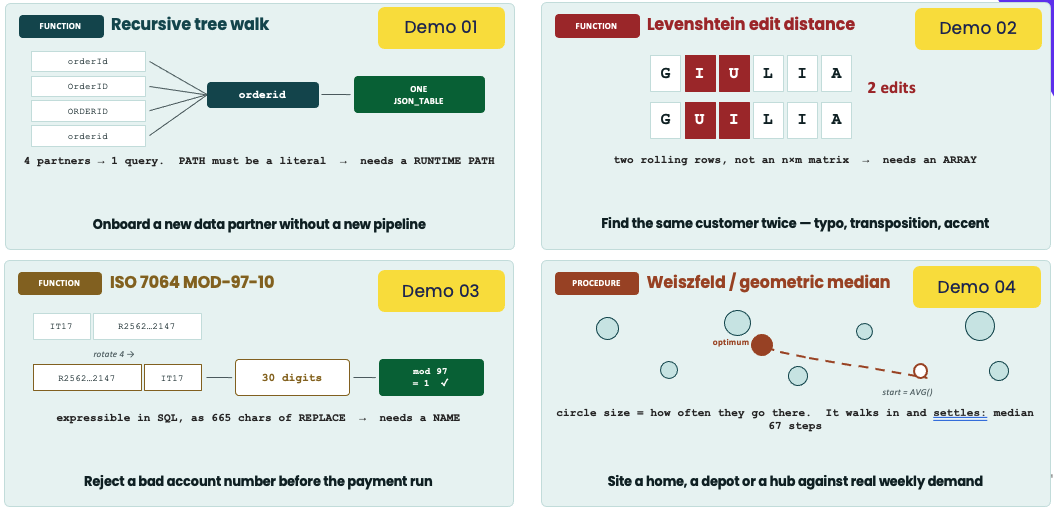
Four demos, one pattern
slide1

Each demo in the pleu_2026 repository follows the same shape: SQL does the set work, a small JavaScript function does the one step SQL cannot phrase, and the decision that matters to the business stays in the application.

Demo What SQL could not do The JavaScript piece Result What stays in the application
Normalize JSON keys Walk a JSON tree of unknown shape; four partners spell customer.id four ways norm_keys(), 9 lines One report went from 51 lines with four UNION ALL branches to 19 lines with no partner names Which partners to onboard and what the report means
Validate input at the door Proper-case names, normalise phones, run an IBAN mod-97 on a 29-digit number proper_name(), clean_email(), clean_phone(), valid_iban(), clean_contact() 460 of 2,000 rows caught, each with a list of what was wrong What to do with a rejected contact: fix, call the customer, quarantine
Deduplicate customers Levenshtein distance needs a grid, and SQL has no arrays lev_distance() inside a JOIN predicate Name equality found 21.7% of duplicates; blocking in SQL plus two distances found about 80% at 99.7% precision Whether to merge two records, and how
Where should Federico live? Iterate to a geometric median; recursive CTEs refuse aggregates Weiszfeld procedure 11.00 s in procedural SQL vs 0.52 s in JavaScript; 327,033 statements vs 6 Whether Federico actually moves

A few details are worth calling out, because they are exactly where DBAs and developers should meet.

Dedupe: SQL narrows, JavaScript decides the distance. Comparing 3,000 customers with 2,000 signups is six million pairs. We never let JavaScript see them all. Ordinary join predicates on city and initials cut the work to 21,352 pairs, and only those reach lev_distance(). The function returns a number. Merging two customers is a business decision, and it stays in the application.

Validation: the function reports, the policy decides. clean_contact() returns the cleaned values and an array of errors. A trigger uses it to guarantee that nothing dirty lands in contacts, whoever does the insert: web app, mobile app, nightly import, or someone at a mysql prompt at 2am. What happens next to a rejected row is still the application's job.

Federico: three steps, one of them JavaScript. Turning 44,347 raw stops into 16,232 weighted endpoints is two window functions, and nothing beats SQL there. Turning the resulting coordinate into a district is plain joins. JavaScript only runs the inner loop in the middle. Note that this demo uses session.runSql(), so today it runs on MySQL Enterprise; SQL from JavaScript is the top roadmap item for Percona Server.

Where we draw the line

A JavaScript routine belongs in the database when it makes a data operation possible or cheaper. It belongs in the application when it decides what the business does. In practice we use five questions before accepting a routine:

  1. Does it work on values the database already holds? If it needs an external service, a file or a user session, it is application code.
  2. Is it deterministic, with no side effects outside the transaction? DETERMINISTIC NO SQL is not only a binlog requirement; it is a good design filter.
  3. Is it called from SQL? A good routine sits inside a SELECT, a JOIN, a JSON_TABLE or a trigger. If nothing in SQL calls it, ask why it is in the database.
  4. Is the result smaller than the input, or does it save a round trip? Two numbers out instead of 5,000 names, emails and cities is the kind of win we want.
  5. Would every client need the same rule? Validation that the web app, the mobile app and the importer all must apply is a data rule. Pricing for a campaign that changes next week is business policy.
Belongs in a JS routine Stays in the application
Normalising and validating values (keys, names, phones, IBAN) Workflows, approvals, notifications
Distance, similarity, checksum and parsing functions Decisions based on those scores: merge, reject, refund
The inner loop of a numeric algorithm over rows SQL selected Orchestration across services and external APIs
Integrity rules every writer must obey UI, sessions, authentication flows
Reshaping JSON so SQL can query it Business rules owned by product and changed often

If a routine starts to need configuration tables, feature flags or calls to another system, that is our signal that it has crossed the line.

Why developers should ask for it

For developers this is not about giving up control of the application. It is about no longer having to pull data out of MySQL just because SQL could not express one step.

  • It is the language you already write. ECMAScript on V8, the same runtime as Chrome and Node.js. JSON columns arrive as native JS objects, no JSON.parse() needed.
  • Fewer round trips. In the commute demo one CALL read 16,232 rows and wrote 2,000 answers with zero rows crossing the network. The speed-up from 11.00 s to 0.52 s came from not crossing the executor boundary 327,033 times, not from JavaScript being a faster language.
  • Less personal data in motion. The dedupe query returns two numbers instead of shipping 5,000 names, emails and cities to an app server, and into its logs. Your GDPR scope stays in the database.
  • One rule, written once. Validation that lives in five clients becomes four out-of-date copies. A function and a trigger are one copy nobody can bypass.
  • Simpler queries in your code. norm_keys() turned a 51-line, partner-specific report into 19 lines. Partner five becomes a data change, not a code change.
  • Pure functions are easy to test. Deterministic, no I/O, no hidden state: the same unit-testing habits you already have.

How we suggest developers and DBAs work together:

  1. The developer proposes the function, with the SQL that will call it.
  2. The DBA reviews it against the five questions above, and checks if the call site uses blocking or filtering so the function runs on as few rows as possible.
  3. Grant CREATE_JS_ROUTINE deliberately; it is required on top of CREATE ROUTINE, so who can write JavaScript is an explicit choice.
  4. Keep the routine in version control next to the schema migrations.

SQL did not get worse, it got a companion

JavaScript in MySQL is not an invitation to rebuild the application inside the server. 

It is a set of sharp tools for the few places where SQL and PL run out: recursion, arrays, big numbers and tight loops. The set work stays in SQL, the business logic stays in the application, and JavaScript fills the gap between them.

If you want to try it, component_js_lang is available as a tech preview in Percona Server for MySQL 8.4.5-5 and later, free and open source, while the equivalent feature from Oracle requires MySQL Enterprise. 

You can easily use the code available here Demo code from Percona Live Europe 2026 to perform some tests, just doing cut and paste. 

Tell us what you think on the Percona Community Forum or in Jira with the label PS-JS-LANG. Your feedback decides what goes into GA, starting with SQL execution from JavaScript routines.

Resources
  • Percona Server js_lang documentation
  • Demo code from Percona Live Europe 2026
  • Source code on GitHub
No comments on “JavaScript in MySQL: Extending SQL, Not Moving the Application”

PGO or not PGO this is the dilemma. Step 3

Details
Marco Tusa
MySQL
09 October 2026

Step 3: Why my sysbench-trained build loses and how to do it right.

Given the topic complexity and the length of this article I have split it in 3 three different blog-post:

  1. What is PGO
  2. How PGO it works
  3. Why my sysbench-trained build loses and how to do it right.

Three compounding reasons:

  1. Uncovered code gets pessimized.
    Sysbench-tpcc touches a narrow slice of mysqld.
    Every function with zero counts is treated as cold: GCC optimizes it for size, skips inlining, and shoves it into cold sections.
    But at runtime I still execute plenty of code my training never touched, such as purge, flushing, stats recalculation, error paths, different optimizer plans, connection churn.
    All of that is now running de-optimized code, and I pay icache penalties every time hot code calls into "cold" regions.
    This is why GCC added -fprofile-partial-training, without it, a narrow profile actively hurts everything outside it.
  2. High-concurrency instrumented runs produce corrupted or skewed profiles.
    GCC's profile counters are non-atomic by default.
    With 128–1024 threads hammering the same counters I get lost updates and internally inconsistent counts (I actually had "profile count data file corrupted/inconsistent" warnings at the -fprofile-use compile).
    I need to use -fprofile-update=atomic, which almost nobody sets and was at the beginning not aware of.
    In short my profile was garbage and a garbage profile is worse than no profile, consistent with my PGO build being slower than plain -O3 at 128 threads.
  3. Instrumentation distorts what "hot" means under contention.
    The instrumented binary is 2–10x slower, which shifts where threads pile up. Spin loops in mutexes and rw-locks record enormous counts, so the compiler lavishes optimization on waiting code instead of useful work. While at high thread counts my real bottleneck is lock contention and memory latency things branch layout can't fix.

Do I have a way to merge the different profiles like MTR + sysbench?
The answer is yes. For GCC it's simple to do so, because the runtime automatically merges profile data across multiple training runs against the same instrumented binary. I don't need a separate merge step like Clang does.

What it does is that each time an instrumented binary exits, it writes its counters into files. If those files already exist (from a previous run), GCC's runtime adds the new counts to the existing ones rather than overwriting them.
So if I run MTR first, then run sysbench against the same instrumented build with the same FPROFILE_DIR, the second run's counts accumulate on top of the first. The final profile reflects both workloads combined. 

Combining MTR with a moderate-thread sysbench run for PGO training is helpful because the two workloads cover different, complementary dimensions of mysqld's behavior: 

  • MTR sweeps broad functional breadth parser, optimizer, DDL, replication, error paths. However it runs almost entirely single-connection, so it never exercises the branches that only exist under real concurrency, like the contended slow-path of a latch, MVCC visibility checks against in-flight writers, lock-wait queuing, or redo-log group-commit batching;
  • A moderate-concurrency sysbench run (something like 4–64 threads, enough to create actual simultaneous access without descending into the timing-distortion and counter-corruption problems), fills exactly that gap by giving those concurrency-only branches nonzero execution counts, which keeps the compiler from treating them as cold, since cold code paths get optimized for size instead of speed.

So the merged profile ends up with both the wide code coverage MTR provides and the concurrent-path coverage MTR structurally can't, at the cost of only a modest, second-order improvement over MTR alone since PGO's overall gains are already small and this specific slice of the binary is a narrow fraction of total execution.


However even where it does help, I am stacking a small effect on top of a small effect. I have already found PGO vs non-PGO gives me under 5%.
The incremental gain from better-covering a narrow slice of concurrency-only code within that is a second-order refinement.
It is plausibly in the sub-1% range, quite  smaller than the run-to-run noise I had seen just from benchmark variance.

Or at least that is what I now think, let me validate it.

Commands to build the code:

cmake ../mysql-9.7.2 \
-DCMAKE_INSTALL_PREFIX=/opt/mysql_templates/mysql-9.7.2-PGO-instrument \
-DCMAKE_BUILD_TYPE=Release \
-DENABLED_LOCAL_INFILE=1 \
-DWITH_FEDERATED_STORAGE_ENGINE=1 \
-DWITH_ARCHIVE_STORAGE_ENGINE=1 \
-DWITH_PACKAGE_FLAGS=OFF \
-DCOMPILATION_COMMENT_SERVER="Marco compile 9.7.2-PGO instrument" \
-DCOMPILATION_COMMENT="Marco compile 9.7.2 PGO instrument" \
-DCMAKE_C_COMPILER=clang-20 \
-DCMAKE_CXX_COMPILER=clang++-20 \
-DCMAKE_C_FLAGS="-fuse-ld=lld" \
-DCMAKE_CXX_FLAGS="-fuse-ld=lld" \
-DFPROFILE_GENERATE=ON \
-DWITH_LTO=OFF \
-DFPROFILE_DIR=/opt/mysql_source/profile

Run the mtr:

perl mysql-test-run.pl --force --max-test-fail=0 --parallel=8 --suite=main,innodb,innodb_undo,binlog,rpl,perfschema,sys_vars


Then run the sysbench-tpcc test with 64 threads

sysbench /opt/tools/sysbench-tpcc/tpcc.lua --mysql-host=127.0.0.1 --mysql-port=3307  --mysql-user=app_test --mysql-password=test --mysql-db=tpcc --db-driver=mysql --tables=10 --scale=100 --rand-type=uniform --report-interval=1  --histogram --report_csv=yes  --stats_format=csv --db-ps-mode=disable --trx_level=RR --enable_purge=yes --time=600 --threads=64 --mysql-ssl=PREFERRED --mysql-ignore-errors=none  --reconnect=0  run

And got the profile as

[root@sm-blade03 profile]# llvm-profdata-20 show -detailed-summary /opt/mysql_source/profile/mysql.profdata
/opt/mysql_source/profile/mysql.profdata
Instrumentation level: IR entry_first = 0 instrument_loop_entries = 0
Total functions: 52403
Maximum function count: 289910820864
Maximum internal block count: 16881288068
Total number of blocks: 619050
Total count: 2473216025729
Detailed summary:
2 blocks (0.00%) with count >= 289910820864 account for 1% of the total counts.
2 blocks (0.00%) with count >= 289910820864 account for 10% of the total counts.
2 blocks (0.00%) with count >= 289910820864 account for 20% of the total counts.
11 blocks (0.00%) with count >= 16777125216 account for 30% of the total counts.
32 blocks (0.01%) with count >= 7806039615 account for 40% of the total counts.
77 blocks (0.01%) with count >= 3839409465 account for 50% of the total counts.
160 blocks (0.03%) with count >= 2273821592 account for 60% of the total counts.
312 blocks (0.05%) with count >= 1111890303 account for 70% of the total counts.
719 blocks (0.12%) with count >= 365989756 account for 80% of the total counts.
2165 blocks (0.35%) with count >= 85858392 account for 90% of the total counts.
4893 blocks (0.79%) with count >= 24359463 account for 95% of the total counts.
16760 blocks (2.71%) with count >= 2841200 account for 99% of the total counts.
45006 blocks (7.27%) with count >= 148881 account for 99.9% of the total counts.
96619 blocks (15.61%) with count >= 8640 account for 99.99% of the total counts.
157023 blocks (25.37%) with count >= 960 account for 99.999% of the total counts.
220001 blocks (35.54%) with count >= 91 account for 99.9999% of the total counts 

Checking on how counts concentrate: just 2 blocks account for 20% of all executed instructions across the entire training run (almost certainly a tight InnoDB buffer-pool/redo-log/lock_manager loop  counts in the hundreds of billions), while 90% of total execution volume is concentrated in only 2,165 blocks (0.35% of all covered blocks). 

That's the "hot core" PGO is designed to find and optimize aggressively. Meanwhile the long tail,  the other 96%+ of blocks, still has nonzero counts (this is a sparse profile, so anything appearing here was actually executed at least once).

Meaning a huge amount of MTR's functional-path breadth got captured even though it's numerically dwarfed by sysbench's tight hot loops.

This is the ideal shape for a merged profile: a small, extremely hot core (from sustained sysbench load) sitting on top of broad, low-frequency-but-nonzero coverage (from MTR's functional sweep). 

If MTR had contributed nothing, I would have a much flatter, narrower distribution with far fewer total functions covered.
If sysbench had swamped everything with no MTR contribution, I would have a similar shape but with a much smaller "Total functions" number, since sysbench-tpcc only touches a fraction of mysqld's total surface.

Command to build the final optimized binaries:

llvm-profdata-20 merge -sparse /opt/mysql_source/profile/*.profraw -o /opt/mysql_source/profile/mysql.profdata

cmake ../mysql-9.7.2 \
 -DCMAKE_INSTALL_PREFIX=/opt/mysql_templates/mysql-9.7.2-PGO-optimized-MTR-sysbench \
  -DCMAKE_BUILD_TYPE=Release \
  -DENABLED_LOCAL_INFILE=1 \
  -DWITH_FEDERATED_STORAGE_ENGINE=1 \
  -DWITH_ARCHIVE_STORAGE_ENGINE=1 \
  -DWITH_PACKAGE_FLAGS=OFF \
  -DCOMPILATION_COMMENT_SERVER="Marco compile 9.7.2-PGO optimized MTR+sysbench" \
  -DCOMPILATION_COMMENT="Marco compile 9.7.2 PGO optimized MTR+sysbench" \
  -DCMAKE_C_COMPILER=clang-20 \
  -DCMAKE_CXX_COMPILER=clang++-20 \
  -DFPROFILE_USE=ON \
  -DFPROFILE_DIR=/opt/mysql_source/profile/mysql.profdata \
  -DWITH_SSL=system -DWITH_ZLIB=system -DWITH_LZ4=system -DWITH_ICU=system \
  -DWITH_NUMA=ON -DWITH_LTO=ON -DWITH_LD=lld -DWITH_SYSTEMD=1 \
  -DWITH_UNIT_TESTS=OFF -DWITH_ROUTER=OFF -DMYSQL_MAINTAINER_MODE=OFF

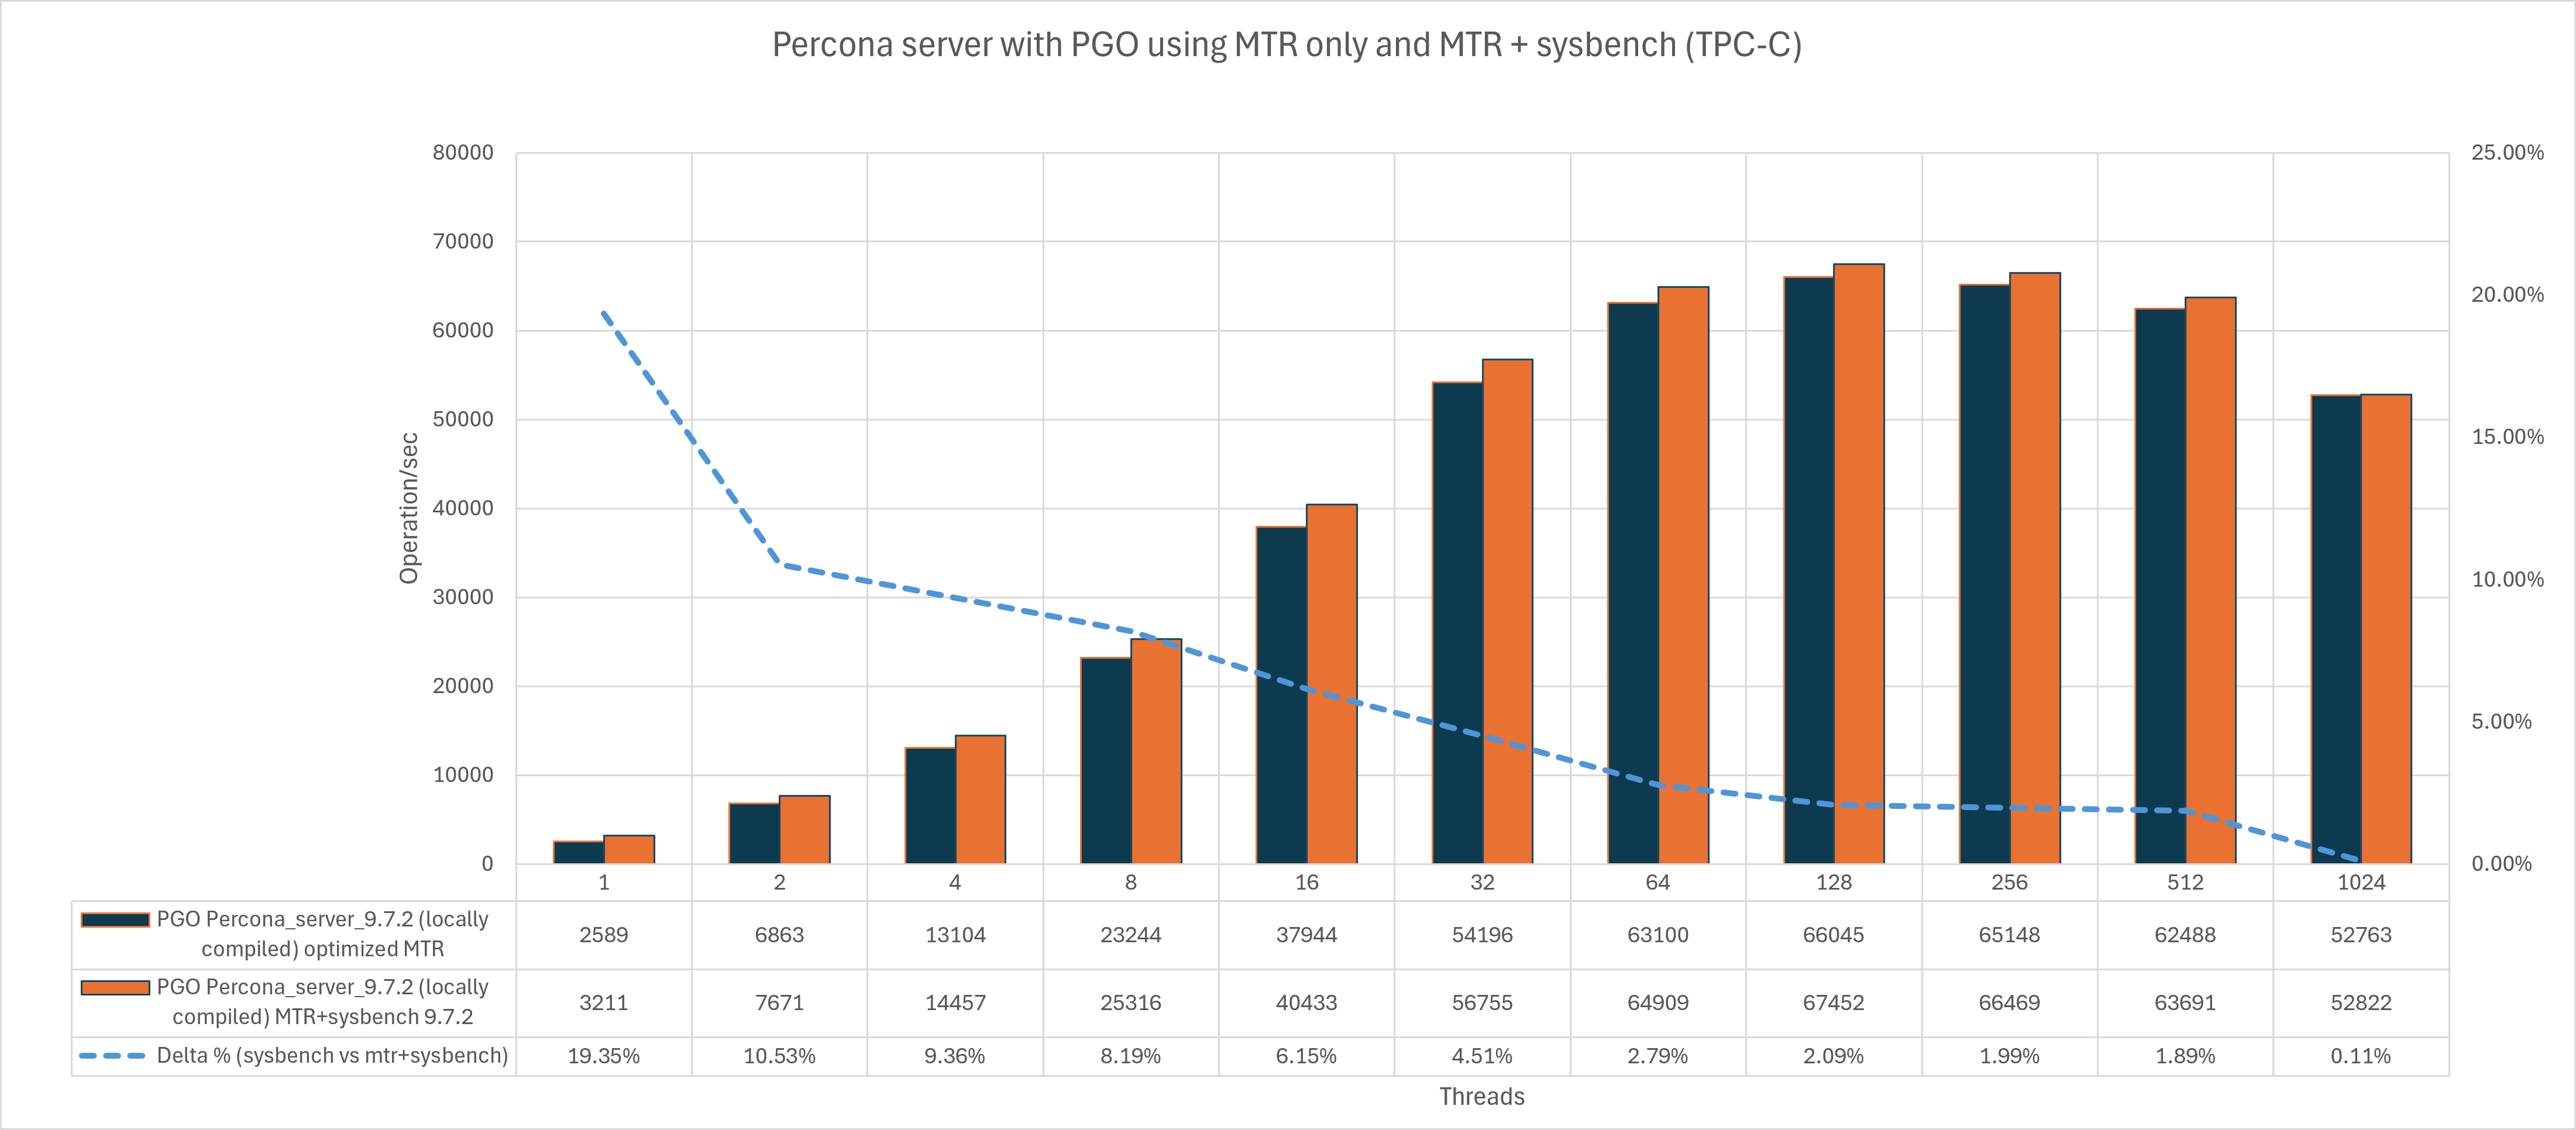
Re-running the test I got this:


As expected the benefit I got was minimal, something was there but that disappeared while the concurrency increased.


Conclusions

  • Non-PGO vs PGO comparison: we had a 12% increase with low concurrency. But when simulating a more realistic load with higher contention the win becomes smaller and smaller, under 2%.
  • Training-workload choice mattered a lot: a sysbench-tpcc-trained PGO build ended up slower than a non-PGO.
  • After switching to a merged MTR + moderate-concurrency-sysbench training profile and re-running, the gain was still minimal, and it shrank further as concurrency increased.


Why the sysbench-only build lost

Sysbench-tpcc only exercises a narrow slice of mysqld, so everything outside that slice (purge, flushing, stats, error paths, alternate optimizer plans) gets pessimized as "cold" code.

At 128–1024 threads, GCC's non-atomic profile counters get corrupted under contention unless I explicitly set -fprofile-update=atomic,a garbage profile is worse than no profile at all.

Instrumentation overhead (2–10x slowdown) distorts what looks "hot" under load mutex/rwlock spin loops dominate the counts, so the compiler optimizes waiting code instead of real work, while the actual bottleneck (lock contention, memory latency) is something branch layout can't fix anyway.

Bottom line: PGO for MySQL/Percona Server binaries does work in the sense that the mechanism is sound whole-binary function reordering for something the size of mysqld is a legitimate, often the single biggest, win in PGO generally. 

But empirically here the payoff was consistently small (sub-5%, trending toward sub-1% for the concurrency-specific refinement), fragile to training-workload choice, fragile to build-flag correctness (atomic counters, -fprofile-partial-training), and it erodes further as thread count rises,  which is exactly what happens in production and what we care about most.

So my practical answer: it's not a clear "yes, always compile with PGO." It's more a “maybe, and only if you get every detail right". Correct broad-coverage training data (MTR, ideally merged with moderate-concurrency sysbench), atomic profile counters, and realistic expectations that the win is marginal and shrinks under heavy concurrency. 

Get any of those wrong and you can end up worse than a plain build.
Given the size of the benefit versus the number of ways to mess up the training methodology, PGO reads more like a niche optimization for a well-controlled build pipeline than a default you'd flip on broadly.

I would be more than happy to prove wrong and I am eager to get other people's feedback, so please test, test, test and let me know. 


Happy MySQL to everyone

Go to:

What is PGO

How PGO it works

No comments on “PGO or not PGO this is the dilemma. Step 3”

PGO or not PGO this is the dilemma. Step 2

Details
Marco Tusa
MySQL
09 October 2026

Step 2: How it works

Given the topic complexity and the length of this article I have split it in 3 three different blog-post:

  1. What is PGO
  2. How PGO it works
  3. Why my sysbench-trained build loses and how to do it right.

How PGO works: PGO is a two-pass build. First pass compiles with instrumentation (-fprofile-generate): every basic block and branch gets a counter.
You run a training workload, counters are dumped to profraw files.
Second pass recompiles using those counts to drive inlining decisions, branch layout (hot path falls through, cold path jumps away), hot/cold function splitting, code ordering for icache/iTLB locality, loop unrolling, and indirect-call promotion.
Crucially, PGO is not "make the trained workload fast" it's "tell the compiler which code is hot and which is cold, and let it reshape the whole binary accordingly."


But how does it work?

Phase 1: what actually gets recorded. The instrumented binary has counters injected at compile time one per edge in the control-flow graph, not just per function.
So for every branch, every loop back-edge, every call site, there's a counter that increments each time execution takes that path.
This is finer-grained than "function X was called N times" it's "when we reached this branch, we went left 950,000 times and right 50 times."
That per-edge granularity is what lets the second phase make surgical decisions rather than just "function X is hot, function Y is cold."

Phase 2: what the compiler does with those counts. Several distinct transformations, all driven by the same counter data:

Inlining.
Normally the compiler inlines based on static heuristics:

  • function size call-site count
  • estimated cost/benefit. 

With profile data it can override those heuristics: a call site executed millions of times gets inlined even if it looks "too expensive" by static cost rules, because the runtime benefit clearly outweighs the code-size cost. 

A call site that's technically inlinable but sits in dead-cold code gets left as a real call inlining it would only bloat the binary for no benefit.

Branch layout.
Every "if" in our code compiles down to a branch instruction with two possible outcomes: 

  • continue straight to the next instruction
  • jump somewhere else. 

Continuing straight is basically free; the CPU is already fetching instructions in order, so there's no extra cost.
Jumping is not free: the CPU has to guess in advance which way a branch will go so it can keep fetching ahead of time, and if it guesses wrong, it has to throw away the work it already queued up and start over from the right place.

That is the "pipeline bubble," a small stall. So the "straight through" path is cheap and the "jump elsewhere" path carries a penalty when the guess is wrong. 

The compiler arranges the hot path as the fall-through and pushes the cold path out of line; literally relocated to a separate location in the binary, often into a .text.unlikely section.
So an if (unlikely_error_condition) { ...rare handling... } block doesn't sit inline interrupting the hot path anymore; it is moved somewhere else entirely, and the hot path becomes a straight run of instructions with no diversion.

To be clear, reordering our if/else in the source code usually doesn't change how the compiler lays out the machine code. Optimizing compilers decide branch layout themselves based on either profile data (PGO) or static heuristics, not on which branch we happened to write first in the source. So swapping the order of our if blocks by hand generally has little to no effect on the compiled result.

Hot/cold function splitting.
This is the same idea applied within a single function.
A function might have a hot core loop and a rarely-hit error-handling tail.
The compiler physically splits the function into two pieces: 

  • the hot part stays in .text.hot
  • the cold part moves to .text.unlikely. 

The function still works identically (a jump connects them when needed), but now the hot part is smaller and denser, so more of it fits in an instruction-cache line, and cold code that's almost never touched isn't wasting icache space sitting next to it.

Whole-binary function reordering.
This is where "reshape the whole binary" becomes literal.
At link time (especially with LTO, which MySQL's PGO build enables), functions get physically reordered in the final executable so that functions which call each other frequently, or execute in sequence during a hot workload, are placed near each other in memory.
This maximizes instruction-cache and iTLB locality; the CPU's fetch unit is pulling in a tight cluster of hot functions instead of jumping all over a 100+MB binary.
For something the size of mysqld, this is often the single biggest win, because normal builds place functions in whatever order the source files happen to be compiled, which has no relationship to runtime call patterns.

Indirect-call promotion.
If profile data shows a virtual call or function-pointer call resolves to the same target the overwhelming majority of the time (common in C++ with vtables, e.g. a storage-engine interface with basically only InnoDB registered), the compiler inserts a guarded direct call: "if target == this specific address, call it directly and skip the indirect jump; otherwise fall back to the indirect call."
Direct calls are cheaper and more predictable for the branch predictor than an indirect jump through a table.

Register allocation and code density trade-offs.
Hot code gets compiled favoring speed, more aggressive unrolling, more registers dedicated to hot-path values.
Cold code, especially with -fprofile-partial-training and cold-path treatment, gets compiled favoring size, fewer registers, less unrolling because it barely executes. So runtime cost there is irrelevant but its footprint in the binary is not free (it still occupies disk/page-cache space and can evict hot lines from cache if placed carelessly, which is exactly why it gets segregated into .text.unlikely rather than just left unoptimized in place).

Switch/jump-table lowering.
A switch statement with many cases can be compiled as a jump table (fast, O(1), but requires a full table load and indirect jump) or as a cascade of compares (slower per-case but better branch prediction if one case dominates).
Profile data tells the compiler which case actually dominates in practice and picks accordingly.

Given the above,  "reshape the whole binary" is not metaphorical. The compiler is redrawing the physical layout of machine code in the executable: which instructions are adjacent to which, which code sections are hot and packed tightly versus cold and shoved to the side, which calls are direct versus indirect, and where the CPU's fetch/prediction effort gets spent.
None of this requires the values processed during training to resemble production traffic. It only requires the shape of control flow.
Which branches, functions, and paths are frequently exercised to resemble production traffic.
That's the core reason MTR's broad-but-different-data coverage transfers well: it walks nearly every code path in mysqld even though the actual queries and data are nothing like a TPCC workload, and control-flow shape is exactly what PGO optimizes for.


Why my sysbench-trained build loses and how to do it right.

No comments on “PGO or not PGO this is the dilemma. Step 2”

More Articles …

  1. PGO or not PGO this is the dilemma. Step 1
  2. The Galera Crossroads: Why PXC is the Lifeline for MariaDB Community Users
  3. Stop Guessing Your Kubernetes MySQL Configs: Meet the MySQL Operator Calculator
  4. The Failover Brownout: Rethinking High Availability in MySQL Group Replication
  5. Group Replication VS Percona XtraDB Cluster: The True Cost of Consistency
  6. MySQL Belgian Days and FOSDEM 2026: My Impressions
  7. joins... joins... everywhere
  8. The 10 TB Scale Survival Guide for Percona Operator PXC on Kubernetes
  9. MySQL January 2026 Performance review
  10. How to Set Up the Development Environment for MySQL Shell Plugins for Python
  11. MySQL latest performance review
  12. How to migrate a production database to Percona Everest (MySQL) using Clone
  13. Sakila, Where Are You Going?
  14. Is MySQL Router 8.2 Any Better?
  15. Export and import of MySQL passwords using caching_sha2 
  16. Proof of Concept: Horizontal Write Scaling for MySQL with Kubernetes Operator
  17. Which is the best Proxy for Percona MySQL Operator?
  18. Help! I am out of disk space!
  19. MySQL Dual password how to manage them programmatically
  20. ProxySQL support for MySQL caching_sha2_password
  21. Zero impact on index creation with Aurora 3
  22. A face to face with semi-synchronous replication
  23. Online DDL with Group Replication In MySQL 8.0.27
  24. A look into Percona XtraDB Cluster Non Blocking Operation for Online Schema Upgrade
  25. What if … MySQL’s repeatable reads cause you to lose money?
  26. MySQL on Kubernetes demystified
  27. Compare Percona Distribution for MySQL Operator VS AWS Aurora and standard RDS
  28. Boosting Percona MySQL Operator efficiency
  29. MySQL Static and Dynamic privileges (Part1)
  30. MySQL Static and Dynamic privileges (Part2)
  31. 260 (Thousands) thanks
  32. Percona Live 2021 - my agenda picks
  33. Inconsistent voting in PXC
  34. Online DDL with Group Replication Percona Server 8.0.22 (and MySQL 8.0.23)
  35. What you can do with Auto-failover and Percona Server Distribution (8.0.x)
  36. Percona Distribution for MySQL: High Availability with Group Replication solution
  37. Who is drop-in replacement of 
  38. Full read consistency within Percona Operator for MySQL
  39. Percona Operator for MySQL (HAProxy or ProxySQL?)
  40. Support for Percona XtraDB Cluster in ProxySQL (Part Two)
  41. Support for Percona XtraDB Cluster in ProxySQL (Part One)
  42. Aurora multi-Primary first impression
  43. MySQL Asynchronous SOURCE auto failover
  44. Using SKIP LOCK in MySQL For Queue Processing
  45. Deadlocks are our Friends
  46. Achieving Consistent Read and High Availability with Percona XtraDB Cluster 8.0 (Part 2)
  47. Achieving Consistent Read and High Availability with Percona XtraDB Cluster 8.0 (Part 1)
  48. Sysbench and the Random Distribution effect
  49. #StopTRUMP
  50. Dirty reads in High Availability solution
Page 1 of 26
  • Start
  • Prev
  • 1
  • 2
  • 3
  • 4
  • 5
  • 6
  • 7
  • 8
  • 9
  • 10
  • Next
  • End

Related Articles

  • The Jerry Maguire effect combines with John Lennon “Imagine”…
  • The horizon line
  • La storia dei figli del mare
  • A dream on MySQL parallel replication
  • Binary log and Transaction cache in MySQL 5.1 & 5.5
  • How to recover for deleted binlogs
  • How to Reset root password in MySQL
  • How and why tmp_table_size and max_heap_table_size are bounded.
  • How to insert information on Access denied on the MySQL error log
  • How to set up the MySQL Replication

Path

  1. Home
  2. Technical Tips
  3. MySQL
  4. Geographic replication with MySQL and Galera

We have 23215 guests and one member online

login

Remember Me
  • Forgot your username?
  • Forgot your password?
Bootstrap is a front-end framework of Twitter, Inc. Code licensed under MIT License. Font Awesome font licensed under SIL OFL 1.1.